The guys at Goodhertz put together a good post with quite a bit of detail about the various types of panning available. We had a brief exchange on twitter about level-based panning:
How Panpot works in four graphs — https://t.co/JLUdwGwmWK pic.twitter.com/kVgqalFo08
— Goodhertz (@goodhertz) March 19, 2015@goodhertz @devink actually been thinking about level panning for a while. Some consoles use 4.5 dB attenuation at detent, right?
— Jeff Vautin (@jeffvautin) March 20, 2015@jeffvautin @devink yeah, SSL most famously
— Goodhertz (@goodhertz) March 20, 2015@jeffvautin @devink we included -2.5, -3, -4.5, -6 & stereo balancer pan laws
— Goodhertz (@goodhertz) March 20, 2015I had read about the SSL -4.5dB pan curve a while back. Supposedly this came about because in good1 rooms, the rooms in which SSL consoles were installed, the audio from both channels tended to be more correlated at the listening position than in other rooms. If the audio arriving at your ears is perfectly correlated, it should sum in amplitude, and you would actually want the center position of the pan to be -6dB from the edges of the curve. -3dB only makes sense if the arriving sound is perfectly uncorrelated, or random.
In reality, you probably want something that was frequency dependent. Since low frequencies tend to arrive at your ears in a correlated fashion, while the high frequency content probably arrives fairly randomly, you would want a gradual transition from -6dB to -3dB. My guess is that the SSL boards choose -4.5dB as a compromise.
But how do you generate these curves? The -3dB curve is fairly straightforward. If you normalize your pan values to cover the range 0-1 (where 0 is all the way left, and 1 is all the way right), you can just use:
\[ \begin{align} {gain}_{left} & = \left( \cos { \frac{\pi}{2} \color{red}{pan}} \right) \\ {gain}_{right} & = \left( \sin { \frac{\pi}{2} \color{red}{pan}} \right) \end{align} \]
To get to -6dB, you actually need to square the curves for -3dB:
\[ \begin{align} {gain}_{left} & = \left( \cos { \frac{\pi}{2} \color{red}{pan}} \right)^{2} \\ {gain}_{right} & = \left( \sin { \frac{\pi}{2} \color{red}{pan}} \right)^{2} \end{align} \]
So how do you generalize this? You can use:
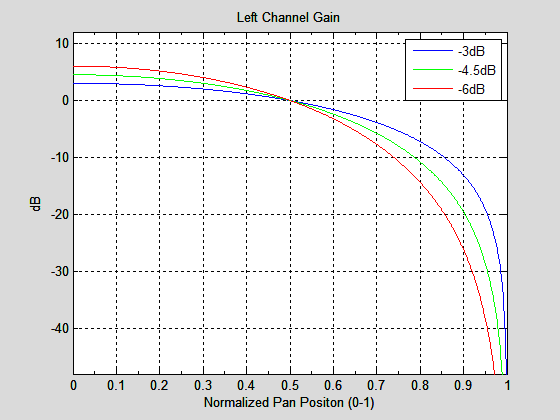
\[ \begin{align} {gain}_{left} & = \left( \cos { \frac{\pi}{2} \color{red}{pan}} \right)^{\frac{\color{red}{dB}}{3.01}} \\ {gain}_{right} & = \left( \sin { \frac{\pi}{2} \color{red}{pan}} \right)^{\frac{\color{red}{dB}}{3.01}} \end{align} \]
Where dB is any amount of attenuation at detent (for instance, the SSL -4.5dB value). This figure shows the resulting tapers (normalized for a pan of 0.5):

So what should you use? Probably -3dB, since that’s the most common value. Better still, try to avoid panning constant sounds around too much, to avoid detecting changes in level as the sound moves. It’s nearly impossible to make the levels seem constant in the studio, in homes, and on headphones. If your sources are static in position, the pan taper you use doesn’t matter at all!
-
It might sound better in the studio, but the consumer never hears it in the studio. They’ll hear it at home, in the car, and on headphones. What happens in the studio is almost irrelevant! ↩